Overview on Aging Mechanism
Overview of lithium-ion battery aging mechanisms such as SEI growth, lithium plating and particle cracking, and how capacity and resistance are measured.
The aging of lithium-ion batteries (LIBs) and its prediction have been a key topic in the battery community for many years. Because of the complex nature of batteries and the importance of a long service life, understanding and predicting aging behaviour and lifetime is indispensable. This article gives an overview of the main aging mechanisms and of the measurements used to quantify them.
Analyzing aging behaviour relies on correctly distinguishing between irreversible and reversible capacity losses. Aging experiments are generally divided into two types:
Calendar aging: cells are stored under different conditions for several months or years.
Cyclic aging: cells are repeatedly charged and discharged, often replicating real use cases.
Both rely on precise measurements to separate irreversible effects, such as the loss of cyclable lithium and active material, from reversible effects, such as temperature-dependent rate capability. The two key parameters measured in the lab are the actual capacity and the internal resistance. Aging ultimately reduces the battery's ability to store energy and to provide the required power.
Main aging mechanisms
The main causes of LIB aging and their effects can be summarized as follows [1]:
Solid electrolyte interphase (SEI): unavoidable; forms mainly on the graphite anode but can also occur on the cathode. It is influenced by the electrolyte and accelerated by high current rates and high depth of discharge (DoD). Result: increase in cell impedance and power loss.
Lithium plating on the anode: occurs during charging at low temperatures and/or high current rates, and when the cell is overcharged. It affects graphite anodes; cells with LTO anodes are not affected because of the higher electrode potential of LTO. Result: accelerated aging and a safety risk.
Particle cracking at the anode: accelerated by overcharging (very high state of charge). Result: capacity loss through loss of lithium and loss of active material.
Electrolyte and binder decomposition: accelerated by high temperatures and high state of charge. Result: capacity and power loss.
Decrease of active surface area due to continuous SEI growth: accelerated by high temperatures and high state of charge. Result: impedance increase and power loss.
Contact loss of active material particles due to volume changes: accelerated by high current rates and high DoD. Result: capacity loss.
Corrosion of the current collectors: accelerated by low state of charge and deep discharge. Result: impedance increase and power loss.
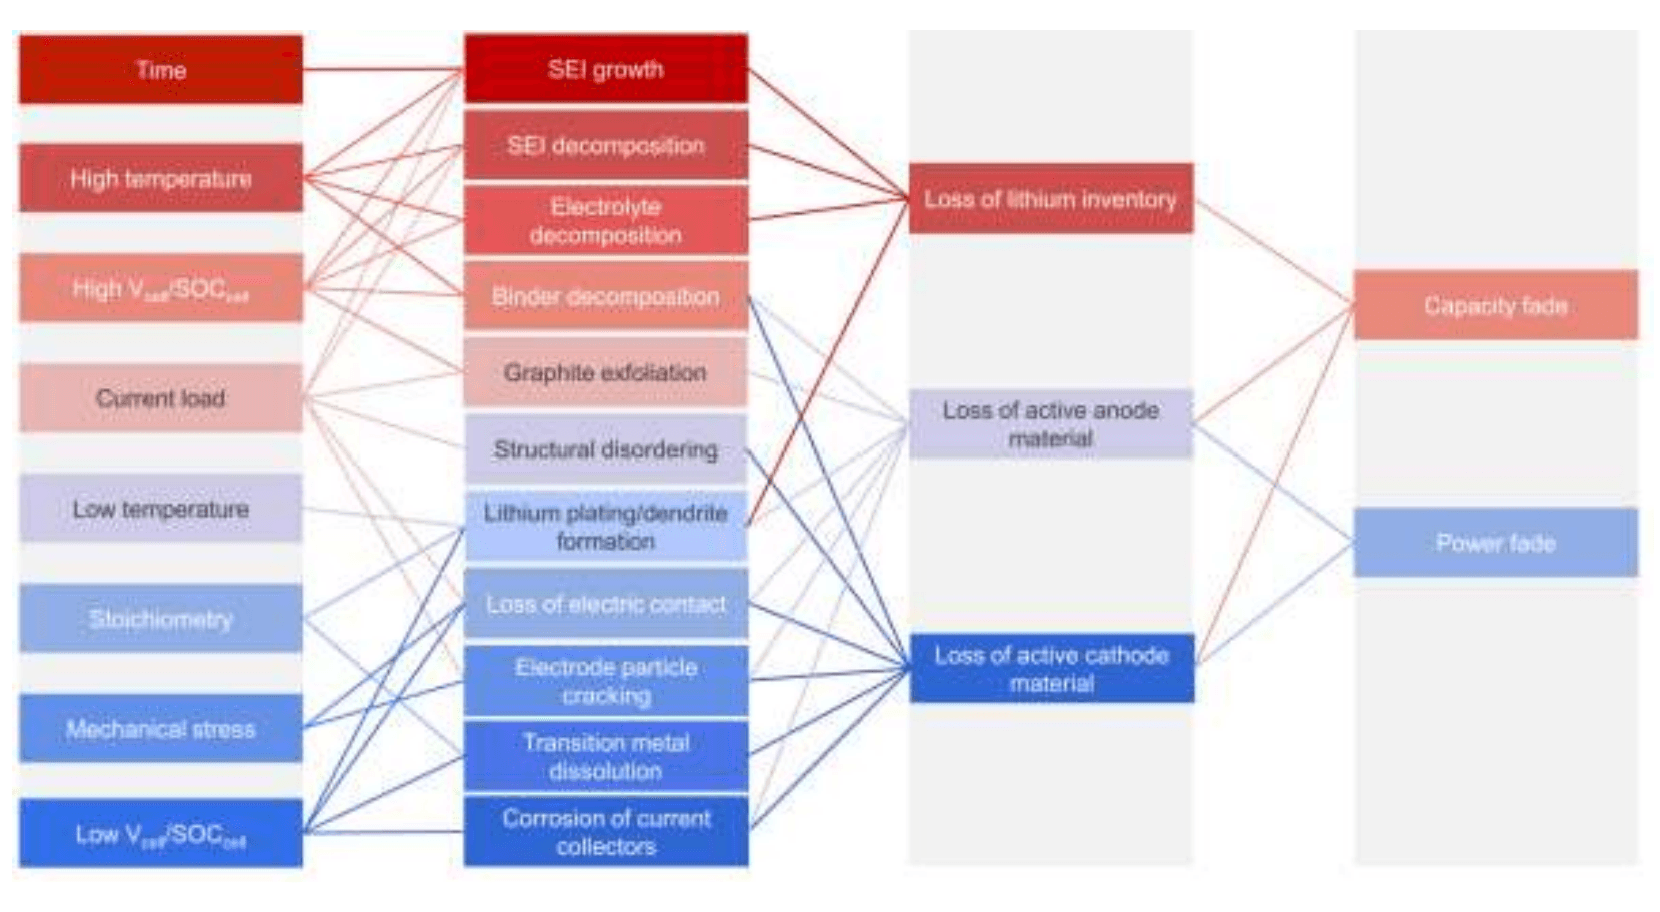
Figure 1 illustrates the interdependencies between the root causes, the resulting degradation mechanisms and the aging modes.

Fig. 1: Root causes of battery aging, degradation mechanisms and resulting aging modes. Source: C. R. Birkl et al. [3], licensed under CC BY 4.0.
Lithium-ion batteries generally show one of three aging trajectories: linear, sub-linear or super-linear.
Recommendations for aging tests
To obtain reliable test data, each operating point of the test matrix should be tested with a batch of three or more cells with similar capacity and resistance. State of charge (SoC) and DoD should be related to the nominal capacity of the cells, and the temperature should be kept constant throughout the test. The two essential measurements for cell and module testing are described below.
Measurement of resistance
Battery resistance is essential for accurately estimating the current aging state. Resistance measurements are divided into a.c. and d.c. resistance. The a.c. resistance measurement is preferred at cell level rather than at system level, mainly because of inhomogeneities within a battery system.
The d.c. resistance is measured differently: the cell or battery system is discharged or charged at a defined SoC for a specific period, for example 10 or 30 seconds [2]. The current pulses are repeated for different current rates and SoCs. Charging pulses can follow the discharging pulses after a short rest, for example 60 seconds. The resistances are determined as follows:
Eq. 1: Ra.c. [Ω] = Vrms / Irms
Eq. 2: Rd.c. [Ω] = (V2 − V1) / (I2 − I1)
Measurement of actual capacity
Compared to resistance, determining the actual capacity is relatively straightforward. Following the cell or manufacturer specifications, the cell or system is first fully charged and then discharged at 25 °C with the specified discharge current until the end-of-discharge voltage is reached. Capacity is typically expressed in ampere-seconds (As) or ampere-hours (Ah) and is determined at regular intervals, for example every 500 cycles. Aging trajectories from laboratory tests are usually shown as capacity versus cycle number or equivalent full cycles.
Summary
Understanding the aging mechanisms of lithium-ion batteries is essential for reliable lifetime prediction. Knowledge gaps remain and call for high-fidelity tests, post-mortem analysis and extensive field data from different applications, use cases and cell chemistries. Industry, research institutions and other stakeholders are increasingly aware of the importance of understanding and predicting battery aging, and considerable progress has been made. Nevertheless, further effort is needed to improve aging prediction for specific applications.
Need reliable lifetime predictions for your battery project? Explore our testing, characterization and modelling services, or evaluate degradation for NMC, LFP and sodium-ion BESS systems with BESSizer.
References
[1] A. Farmann et al., Critical review of on-board capacity estimation techniques for lithium-ion batteries in electric and hybrid electric vehicles, Journal of Power Sources 281 (2015).
[2] A. Farmann, Comparative study of reduced-order equivalent circuit models for state-of-available-power prediction of lithium-ion batteries in electric vehicles, Ph.D. thesis, RWTH Aachen University, 2019, ISSN 1437-675X.
[3] C. R. Birkl et al., Degradation diagnostics for lithium ion cells, Journal of Power Sources 341 (2017) 373–386. Open access under the CC BY 4.0 licence (https://creativecommons.org/licenses/by/4.0/).